Categories

A Complete Guide To Customer Satisfaction (CSAT) Score For 2024

Thejas Sridhar
December 23, 2020

The best way to bring in new customers is to take great care of the existing ones. In business terms, a satisfied customer is the best marketing tool your company has. When customer satisfaction is at the nucleus of a company’s efforts and is given huge significance, translating it into measurable metrics and deriving actionable insights from it becomes critical. The fundamental initial question to be answered is, “Are my customers satisfied ?”.

What Is Customer Satisfaction?

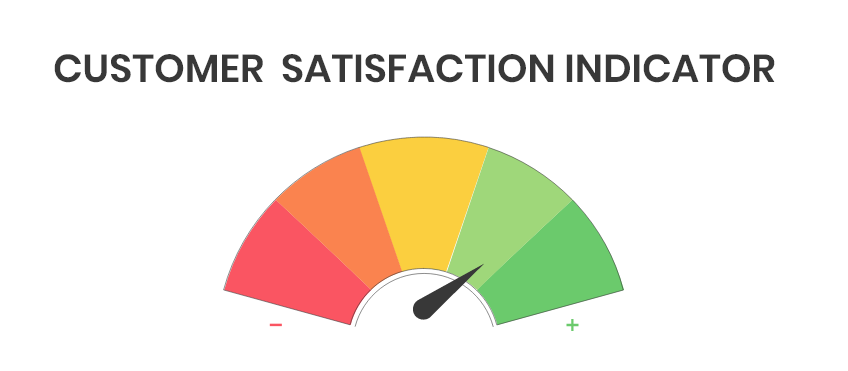
Customer satisfaction is the measure of how happy your customers are after purchasing your offering or service. It indicates how much a customer liked their entire journey with your brand. It is measured through methods such as CSAT surveys and the responses are measured against a CSAT rating scale. If a customer is satisfied with your service or product throughout various touchpoints, you can consider them a thoroughly satisfied customer. Many customers might face bottlenecks at various touchpoints such as training, implementation, support, product updates and more. To capture the sentiments, it’s important to measure numerically “how satisfied customers are?” after every touchpoint using a CSAT score.

What Is A Customer Satisfaction Score (CSAT)?

A numerical value for how satisfied customers are after each interaction measured through surveys is called a CSAT score. It is measured by asking direct questions to customers and taking in their responses on a scale of 1 to 5 where 1 is “Very unsatisfied” and 5 is “Very Satisfied”. The survey is ideally done after every key interaction and is used to pinpoint areas where there is a dip in customer satisfaction.

How To Measure CSAT Score?

CSAT score is measured by dividing the number of customer survey responses that said “Satisfied” or “Very satisfied” by the total number of survey responses.

CSAT score = (No. of customers who responded satisfied and above / No. of survey responses. ) * 100 %

For example, if 40 of your customers responded “Satisfied” and 10 customers responded “Very Satisfied” out of 150 responses, then your CSAT score is as follows

CSAT = {(40 + 10) / 150} * 100  =  33.33%

How To Conduct a CSAT Survey?

A CSAT survey should be aimed at understanding customer perception about your brand and quantifying it, sometimes when the customers are unsure themselves. The survey has to factor in areas such as competitive landscape, pricing, service and more.

The details of survey respondents are also important as they represent different demographics. Age, gender, culture all play a significant role in the way customers respond. For example, a customer from India or Japan is more likely to respond with the median value of “Satisfied” or “Neutral” but a customer from the United States will most likely be vocal about their feelings and will not shy away from responding “Very Unsatisfied”.  Yes, “Very Unsatisfied” is a bad response despite demographics. But when a customer from Vietnam or Singapore responds with it, there has been a much more serious letdown.

It is important to establish the areas of the survey. The entire CSAT score works in the market because it is a short, relatively accurate way to assess customer sentiment. Making the survey too long might be detrimental to the cause. 5 questions is a good average to have and more than 10 is definitely to be avoided. Putting these 5 questions to use and mining maximum insights should be the ultimate goal of the survey. Some of the key segments to be targeted in the survey irrespective of market vertical:

  • Product Usage

    Aimed at assessing if your solution or product delivers the promised value proposition to the customer.

  • Support

    Aimed at assessing if there was enough ”˜hand-holding’ for a customer throughout their journey with your brand or if they felt blindsided.

  • Customer Service

    Aimed at judging if there was enough support offered to customers either during their evaluation phase or their post-purchase phase. It can also be an indicator of how well your support team is equipped to handle customer calls.

  • Pricing

    Aimed at assessing if customers are satisfied with your price.  The unique finding of this segment lies in what it indicates. If customers sway towards an extreme of “Very Satisfied” or “Very Unsatisfied”, it could mean that you have either severely under-priced or overpriced your product.

  • Ease Of Access

    Aimed at assessing how easy it is for customers to find out about your service or reach out to you for clarifications. For example, this segment’s response can be negatively impacted by long waiting queues on support calls, or convoluted warranty claims processes.

You can find a ton of survey examples online, draw inspiration from them and tailor surveys to suit your needs. Alternatively, you can contact our team and they would be happy to help you assess your standing.

When To Conduct A CSAT Survey?

The industry best practice is to conduct a CSAT survey after every pivotal customer interaction. They can broadly be classified into:

  • Discovery

    The phase when the customer is trying to find solutions to a problem they’re having or are looking for specific items to fit their needs.

  • Evaluation

    The phase where customers have narrowed down on a select few solutions or products and are either trying them out or reading reviews about what they have in mind.

  • Purchase

    The phase where the transaction of sale happens after negotiations and the deal is sealed. In industries such as IT, this phase includes peripherals like signing MOUs or implementing POCs.

  • Post-purchase

    The phase after sale has been done and relies on how the customer is supported after-sale when they reach out for warranty, training, replacement, issues and so on.

A CSAT survey after every phase can be used to measure the efficiency of activities and interactions that happened with the customer at that phase. This way, it is easy to pinpoint areas that can be improved to enhance the customer experience and effect change in the key indicators of customer satisfaction.

However, the time frame difference can vary from industry to industry. For example, the software industry generally sends out surveys 6 months post-purchase so that customers have significant time to get acclimatized to their solutions. The food delivery industry however has a much shorter time lag between surveys. They prefer customers to rate every order and every dish.

A good thumb rule is to wait till customers have enough experience with your product and send out a survey when their perception of your brand is fresh on their minds.

What Is A Good Customer Satisfaction Score?

According to this article, a good customer satisfaction score typically falls between 80% and 86%. As mentioned earlier in this blog CSAT score and CSAT meaning has to be taken with a pinch of salt. It can be influenced by a variety of factors and the original meaning of the survey might drown in if not handled with careful precision.

You can find a country-wise report on CSAT scores in this report from ZenDesk. CSAT also varies from industry to industry. In 2020, Cellular Telephones rocked the highest CSAT scores in the United States at 80%, a +1.3% change from the previous year. “Televisions and Media Players” ranked 2nd at 80% as well but their CSAT declined by 2.4% year on year. Below are 2019 and 2020 CSAT scores for different industries in descending order of their CSAT growth percentage in 2020:

Industry 2019 CSAT score 2020 CSAT score YoY growth percentage
Internet service providers 62 65 4.8
U.S postal service 70 73 4.3
Subscription Television Service 62 64 3.2
Video On-demand service 67 68 1.5
Airlines 74 75 1.4

You can find specific CSAT scores for different industries according to this American Satisfaction Index (ASCI) here.

CSAT scores give a good measure into how well customers perceive your brand but they have their own set of drawbacks too. In the following table, we take a look at a few of the advantages and disadvantages of CSAT:

Advantages of CSAT Disadvantages of CSAT
Simple and accurate Influenced by many demographics. So a good CSAT score for one company in the same industry might not be the right benchmark across other companies.
Offers high customizability to tailor-make surveys according to specific requirements Often customer response is based on the “sentiment” of their last interaction with your brand and may not correlate to their actual overall experience.
High responsiveness when surveys are direct and short. Is often ignored by companies as the metric contributed only to a perceived brand value and not direct revenue unlike parameters like “Customer Acquisition Rate” (CAR), “Customer Lifetime Value” (CLV) and the like.

CSAT is a great way to derive insights about the ground reality. You can only correct problems you know exist but a key indicator like CSAT helps measure customer perception and throws light onto problems you never knew existed. That being said, CSAT score delivers the best insights when combined with other key indicators of customer success such as Net Promoter Score (NPS) and average deal size. If you’re looking for ways to measure and optimize your business offerings, you can book a free consultation call with our market experts. They will be happy to help you with industry-wise statistics, market trends and how you can navigate through to become a customer-centric business.  Also, don’t forget to share this blog with your friends who are looking out for ways to optimize their business.

Categories

5 Important Indicators of Customer Satisfaction in 2024

Thejas Sridhar
December 22, 2020

Customer satisfaction is the singular, most important metric for any business. Unlike other subjective parameters specific to different brands, customer satisfaction is a uniform metric that needs constant measuring and course correction. When a dip in cx satisfaction score is spotted, it conclusively indicates that something is going wrong. While cx satisfaction is measured using different indicators by different organizations, the overall importance of the indicator stands uncontested. 

The indicators of customer satisfaction are diverse. Often, the diversity of metrics available pushes organizations to track, measure and juggle with much more key indicators of customer satisfaction than necessary resulting in a huge wastage of man-hours and resources. To cut through the clutter, in this blog we take a look at 5 important indicators of customer satisfaction in 2021 that will have the most impact on the business when kept in check. 

1) Customer satisfaction score (CSAT)

Customer satisfaction score is a straightforward way of asking a customer,  whether they were satisfied with the product and service delivered. It is generally measured using surveys at different customer touchpoints bringing to light areas that need improvement. The survey contains profound questions asking customers to rate different touchpoints on an ascending numerical scale (1 to 10, 1 to 5). The score is honest, perceived customer perception and is a key indicator that indirectly quantifies the effectiveness of all other parameters discussed in this blog. The growth or dip in any of the other parameters will have an impact on this score. The wellness of a business is directly proportional to its CSAT score.

2) Net Promoter Score (NPS)

Despite the various channels of marketing now available, the pinnacle value of word-of-mouth marketing or referrals stands uncontested. In fact, according to Nielsen, people are 4 times more likely to buy something when recommended by a friend. Net promoter score, a metric devised and popularized by Fred Reichheld, measures “How likely is it for your customers to refer your business to someone else ?”. The metric ranges between -100 and +100 and classifies customers into “Promoters” – very likely to recommend your brand, “Passive” – may sometimes recommend your brand, and “Detracts” – unlikely to recommend your brand. The NPS score is not a straightforward metric in the sense that it is also influenced by the perceived emotional connection customers have with your brand. NPS’ insights are better understood when combined with other parameters such as CSAT score.

3) Customer effort score (CES)

This indicator metric popularized in 2010 by Harvard Business Review is growing in significance today as the lion’s share of sales have moved online or are in the transition phase. The indicator measures how easy it was for your clients or customers to interact with your various touchpoints. CES is measured by pitting customer responses to a question such as “How easy was it to get a price quote from our team ?” against a numerical scale of 1 to 7 where 1 – indicates “Very Easy” and 7 indicates “Very Difficult”. The numerical CES score is obtained by dividing the numerical sum of all the responses by the total number of survey respondents. As long as your CES is less than 3, your business is doing a good job.
CES = Total sum of survey values / No. of survey responses

4) Average Deal size

If your brand offers a spectrum of offerings, it might be hard to keep a tab on the factors affecting return on investment (ROI) and whether customers are truly getting the value proposition promised. A good indirect measure is combining average deal size with customer acquisition rate (CAR). Average deal size the revenue your business makes per customer. It is numerically obtained by dividing the sum of revenue by the total no. of paying customers. CAR gives you a single point metric whereas the average deal size is also influenced by cross-sell and up-sell deals that happen when a customer chooses to buy more than one offering or to upgrade their offering. It is a wholesome indicator of customer satisfaction. If a customer has traversed through the entirety of the sales funnel and decides to honor another purchase you can be sure that the processes set at various customer touchpoints are working. Here too, the insights delivered by this metric are better understood when clubbed with CAR.

5) Customer Acquisition Rate (CAR)

Customer acquisition rate is defined as the total expense incurred to bring in a new customer. The metric is obtained by dividing the total investment (including marketing, sales, support, client visits, etc.) of an effort divided by the number of customers obtained from the effort. The metric can be computed both campaigns wise and in an overall manner. Generally for a company to stay afloat profitably, their CAR (customer acquisition rate) has to be substantially lower than their average deal size. Let’s break this down with an example. If the CAR for a company is $30 and the average deal size per customer is only $20 then for every new customer acquired, the company is making a net loss of $10. It is important to keep the CAR in sync with the average deal size and the pricing of the product. If CAR is constantly increasing, it could indicate several red flags such as a declining pool of prospects, an increase in marketing competition, a change in market dynamics, and prospects losing faith in your brand.

CAR = Total cost of investment to bring in a customer / No. of  customers obtained

Note: In a subscription-based model, the correlation between average deal size and CAR is trickier. In this case, revenue generated from a customer could be based on timely renewals of the service. Giving rise to another important metric, customer lifetime value.

All the above indicators of customer satisfaction or successful customer experiences aim to translate that into an inflow of revenue. A key indicator to measure the 360-degree success of efforts is the customer lifetime value (CLV). The total revenue a customer brings in throughout their association with your brand is called customer lifetime value. CLV is at least as important as CSAT scores if not more. Primarily because CLV has a direct impact on other metrics spoken about. For example, if CLV of a customer is $100, CAR is $20 and each of a company’s offering sells at $15, it means that although the company is burning $5 for the first sale their ecosystem’s value is so good that they have customers who buy a plethora of their offerings thereby delivering massive profits in the long run.

This list of indicators to measure cx satisfaction is by no means exhaustive and is only aimed at giving direction on what can be changed to help businesses deliver better value. If you are looking for more professional help to optimize your business you can contact our solution specialists here.

Categories

Facebook Messenger Bot Integration using Chatgen

Priyanka Bhaskar
December 21, 2020

Facebook is the biggest social media platform and it loves massive traffic! It serves the purpose of lead generation, collecting feedback, solving queries, etc., thereby helping you turn your leads into customers. With the help of Chatgen and minimal efforts, let your bot take care of all of these tasks! 

Already Excited? Let’s take a look at the installation process.

If you’re new to ChatGen, kindly Sign Up and Create your account by visiting Chatgen. After creating an account on ChatGen please follow the steps given below.

Categories

ChatGen Vs. Intercom

Prasanth Sai
December 14, 2020

Chatbots are the need of the hour for all online businesses. In our blog Chatgen Vs. Intercom, we have tried to clear all your queries related to the platform when compared with Intercom. 

Categories

Future of B2C Communications – AI Chatbots

Faisal Sayed
December 9, 2020

A recent study shows that 9 out of 10 consumers would prefer and pay more for a better customer experience and that a good experience would make 60% of them try a new brand. Therefore, it definitely makes sense to deploy conversational AI platforms to engage with customers.

For those new to the term, conversational AI is a set of technologies enabling devices to interact with humans in the form of personalized conversations. It allows B2C companies to engage with customers across different channels ”“ social media platforms, website, native app, messaging app, text or voice-based chatbot, and Digital Assistants like Alexa, or even voice assistants like Google Home.

Categories

How should a SAAS organisation structure be with respect to the growth?

Prasanth Sai
December 9, 2020

Organization chart:

The definition of an organization chart or “org chart” is a diagram that displays a reporting or relationship hierarchy. The most frequent application of an org chart is to show the structure of a business, government, or other organization. Org charts have a variety of uses and can be structured in many different ways. They might be used as a management tool, for planning purposes, or as a personnel directory.

Categories

What Is a Chatbot and Why Do You Need One?

Prasanth Sai
December 9, 2020

What is a Chatbot?
A Chatbot is a software-programmed, conversational agent which is able to understand human text/speech inputs and respond back with a meaningful answer, in the most natural (read human) way possible.

Chatbots have the ability to simulate entire conversations with humans and the more you interact with them, the more they learn and improve.

Categories

How can ChatGen drive your Sales Funnel?

Prasanth Sai
December 9, 2020

When we look at the growth of marketing and sales we find out that the popular sales funnel or the process through which the potential prospects go through while making the important buying decisions. It is definitely an essential part of your sales development and progress. Although the fundamentals of the sales funnel still remain the same, quite a few of the strategies which marketers make use of in order to make possible the lead movement through the funnel have seen some difference.
Although you may encounter different definitions of sales funnel yet the phases and stages that are the most common ones are :

  • Attention
  • Interest
  • Decision
  • Action

“The core value of Chatgen.ai is to drive this inbound sales funnel journey with minimum response cycle duration”.

Categories

What is Artificial Intelligence or AI?

Prasanth Sai
December 9, 2020

On March 24 2017, at Tempe ” Arizona a Self-driving Uber Volvo was involved in a crash with a human-driven Honda CRV. Luckily, no one was injured. Uber stopped its self-driving services immediately and launched an investigation. As per the reports, the Uber car was not at fault and it was following the rules of the road to perfection. Nevertheless, there were witnesses who observed that if there was a human behind the wheel, this incident could have been avoided.

Categories

Chatgen WordPress Integration

Prasanth Sai
December 9, 2020

What’s Chatgen you ask?
Chatgen’s an advanced LIVE ChatBot platform where you have the power to build your ChatBot in minutes without any coding experience. Chatgen automates chats, qualify leads and also switches between Bot and live agents as per your requirements. With an easy integration process when it comes to WordPress this is the business enhancer you have been looking for.

Let’s take a look at the installation process-